Market Grid
Market Grid is a market scanning tool that produces heatmaps of populated US markets using a uniform grid of data-rich hexagons. Its multivariate filters make it easy to refine the heatmap for as many data and trade area variables as you like.
3. Apply your filters
Once you’re done, Market Grid instantly highlights the trade areas most likely to fit your checklist, so you can scan markets in seconds. All that’s left to do is prioritize where to look for real estate!
How it works
It pre-processes the most current geospatial data available into a consistent grid of 1-mile hexagons that cover the United States. These hexagons give you a more precise, comparable basis for market analysis than other boundaries like ZIP codes or block groups.
Its customizable filters screen markets based on key business metrics—such as demographics, points of interest, and performance data—to produce an easy-to-read heatmap of the trade areas most likely to align with all your filter criteria.
That means you can quickly identify high-potential target areas, prioritize growth opportunities and make data-driven decisions in just a few clicks.
How Market Grid helps you
Unlike static reports, Market Grid offers a dynamic, interactive experience that gives you actionable insights to support your real estate strategy and growth plans. Market Grid helps you:
- Simplify complex geographic data, making it easy to understand and act on opportunities.
- Leverage multiple filters at once to focus on areas that meet specific site selection criteria.
- Develop compelling heatmaps that visualize the data patterns at play in your analysis.
- Save time by quickly narrowing down high-priority trade areas.
- Make faster, smarter decisions with a comprehensive view of your market.
This step-by-step guide shows you how to get started with Market Grid and use it to identify your next big opportunity. Let’s dive in!
How to use Market Grid
This example uses Market Grid to identify areas in Dallas with high daytime and residential populations and a concentration of big box chains. We’ve also provided a video tutorial for a more visual learning experience.
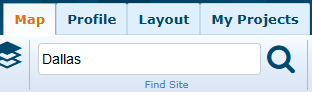 1. Locate the area of interest
Let’s start by navigating to Dallas. Use the search bar at the top, then pan and zoom until you’re centered right where you want to be.
2. Enable the Market Grid layer
In the Layers panel on the right-hand side of the map, check the box for the 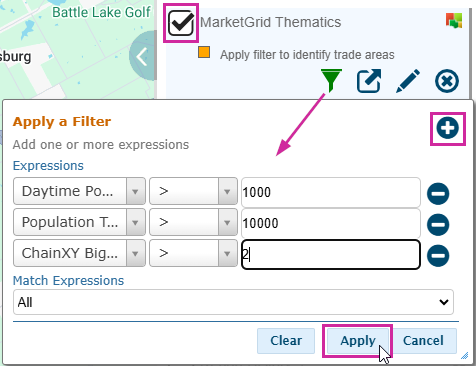 Market Grid Thematics layer.
3. Apply your filters 
The filter pop-up box will automatically appear. Apply the following three filters:
- Daytime Pop Total (1 mi): Set the value to 1000 and select greater than.
- Population Total (3 mi): Set the value to 10,000 and select greater than.
- ChainXY Big Box (5 min): Set the value to 2 and select greater than.
- Use the
icon to add more expressions to the filter. Including multiple criteria narrows down your search.
Now that all three filters are set, click Apply to display the areas that meet all your criteria.
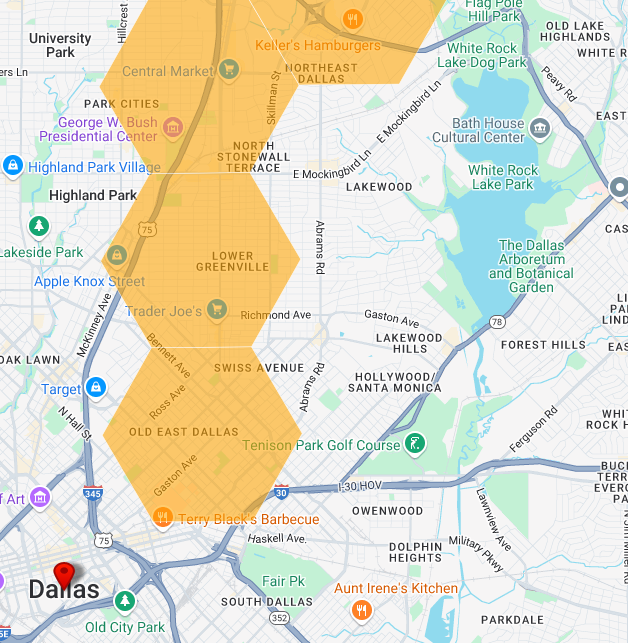 4. Explore the results
On the map, you can see the hexagon that matches the filters you set. This data visualization focuses on your analysis. Let’s dive a little deeper.
- Use the map to pan and zoom in on one of the hexagons within your focus area.
- Click on the hexagon. The Infobox appears with some more granular information about this particular hex.
- Click on the
icon to open the Details Panel on the right-hand side of the map.
- Expand each category to view additional information, such as population breakdowns, household summaries, or other relevant data for each study area.
Interpreting the data
- Each hexagon displays data based on calculations from its centroid (aka the center of the hexagon).
- Your selected study area determines how the data is calculated around the centroid for each hexagon. You can choose between distance rings (1, 3, 5, or 7 miles) or drivetime rings (5, 8, 10, or 15 minutes).
- This means that each one-mile hexagon isn’t just showing you the data within its borders; it represents the data from its center outward to the set distance. Now, you can overlay additional data layers to support your analysis or go explore the available real estate in your refined target areas.
Now you know how to use Market Grid to identify high-opportunity trade areas. You’re ready to impress your team, clients, or partners with faster, data-driven decisions that help you stay ahead of the competition!
Next Steps
If this layer isn’t visible in your mapset, please have your account administrator contact the Sitewise Team.
Want to add other data inputs to visualize in Market Grid? Get in touch with the Sitewise Squad to tell them what you want to see and why, so we can get started on the Market Grid of your dreams.
Related Articles
Study Area Tools
Study Area Tools The study area tools in Sitewise provide additional functionality that helps you get the most out of your study areas. The Profile tab contains many tools allowing you to generate reports, edit projects, and view demographics which ...Create a Study Area Using Polygon Data
Overview Sitewise has the ability to create study areas based on polygon data, providing flexibility when analyzing your data. By leveraging this feature, organizations can tailor study areas to their specific polygons, ensuring more targeted and ...Trade Area Builder
The Trade Area Builder tool is used to create and save Polygon Study Areas, composed of pre-defined geographic units. Pre-defined geographic units are boundaries such as Block Groups, ZIP Codes, Census Tracts, and Metropolitan Statistical Areas. Use ...Circle & Drivetime Study Areas
Quickly and seamlessly profile the demographics of an area of interest by utilizing the many study area tools. In This article will focus on the circle and drivetime option but see all the study area types possible here. Creating a Circle or ...Saved Study Areas
Saved Study Areas The 'Saved Study Areas' repository enables users to store and share study areas within their organization. It also provides a convenient way to revisit previously defined study areas, promoting collaboration amongst others on your ...