Adding Thematic Layers
Thematic layers enable the visualization of complex data, making it easier to identify patterns and trends. These layers, such as heat maps, dot density maps, or symbols, are commonly used to represent demographic data and other variables, offering insights into spatial relationships. These layers can be customized to represent any data variable, with adjustable legend ranges and color schemes tailored to enhance clarity and insight.
Use Cases
- What is the population distribution at the blockgroup level around all of my locations?
- Can I visualize the levels of income in each individual DMA across the country?
- It would be helpful if I could depict daytime population on a map to see where people spend their time during the day. Can I do this in Sitewise?
- My goal is to see the breakdown of race on the map, but I want to see it in proportional symbols so it’s easy to see the density and compare when looking at multiple layers at the same time. Thematic layers can be used to identify high-demand areas by visualizing population density, household income levels, consumer spending patterns amongst a variety of other variables depending on what is included in the demographic database.
Adding a Thematic Layer
First, let’s learn how to access the data and walk through the initial steps of creating a thematic layer. All demographic thematic layers start out the same way. Once you’ve got the basics, move onto the section you need for steps on how to create heat, dot density, or symbol thematics.
- Click the Add Layer
Icon at the top of the layer panel on the right.
- The layer panel will change to show the Add a Map Layer options. You will now have the option of adding a layer from 4 different data sources: Data, Points, My Layers, and Shapes.
- In this article, we’ll use what’s in the Data tab to build our thematic layers.
- You can add your own data as a thematic layer, but we’ll go over this in the Link Geography to a Table article.
Select a Data Variable
In the Data tab, you have the option to add from an existing category, search for a specific variable, or create a custom variable formula. Each option provides a different way to choose the data you want to visualize. Let’s review them together.
Category
Manually select the variable by picking the category and clicking the relevant variable.
- Make sure the Category option is selected.
- Click in the grey box to select the variable category, then choose which variable you want to visualize, as shown below.
- Select the geographic level at which you would like to display the data.
- The most granular level is Blockgroup, which is good for observing variations at a fine scale. There are, however, other options such as ZIP Code, County, DMA, etc. depending on your goals.
- Click Next. The layer panel will change to layer styling which we will go over in the Styling Thematic Layers section.
Search
Search for variables through key words. Use this option if you’re not sure what the variable name is but you know generally what you’re looking for. The search option allows you to search or to choose a variable just like we did in the Category section.
- Make sure the Search option is selected.
- Select the geographic level you would like to display the data at.
- The most granular level is Blockgroup, which is good for observing variations at a fine scale. There are, however, other options depending on your goals.
- Tip: Be sure to choose a geography before selecting a variable, as you won’t be given an option after choosing a variable.
- Search for a variable using key words. For this example, we’re searching for a variable related to household income.
- Tip: To find the variable you want, it might be helpful to try a few different synonyms in your search.
- Once you’ve typed in the key word(s), click Find.
- A list of all data variables that contain the key word(s) will appear in a list.
- Click on the variable that suits your needs. The layer panel will change to layer styling which we will go over in the Styling Thematic Layers section.
Custom
Use this option to add multiple variables together to create one layer, for example total households with income above $150,000. This option is typically used by advanced users since it requires a deep understanding of the data, ensuring that the summed variables accurately represent what you are trying to visualize. If you’re unsure, contact Sitewise Support to ensure your layers are set up exactly as needed.
- Make sure the Custom option is selected.
- Click on the Category dropdown to select the category.
- The list of variables will update based on the category chosen.
- There are a few ways to select variables.
- One by one: Click to highlight a variable, then click the +Numerator button. The code for the variable will be added to the Custom Formula box. Keep doing this until all variables you want to add together are included.
- Select as a group: Click on the first variable you want to include, then hold the shift key and click on the last variable you want to add. Stop holding shift to scroll, then hold shift again before clicking additional variables. Once all variables you want to add are highlighted, click on the +Numerator button. You can keep adding variables even after clicking the +Numerator button.
- Select together individually: Click on the first variable you want to include, then scroll to find the next variable you want to add. Hold the control key and click on the next variable. Do the same until all variables you want to add are highlighted then click on the +Numerator button. You can keep adding variables even after clicking the +Numerator button.
- Notice the custom formula appearing after selecting the variables and clicking the +Numerator button.
- In our example, we want to calculate the total households with income above $150,000. We selected all variables from $150k to $500k or more, then clicked on the +Numerator button and voila! The values have been added together as a custom formula.
- In the Map as Value or Percent dropdown, choose how you want to represent the data when visualizing it on the map
- Select the geographic level you would like to display the data at.
- The most granular level is Blockgroup, which is good for observing variations at a fine scale. There are, however, other options depending on your goals.
- Click Next. The layer panel will change to layer styling which we will go over in the Styling Thematic Layers section.
Now it’s time to style the layer! You’ll notice that the layer panel changed to show layer style options. Let’s talk style.
Styling Thematic Layers
First, let’s review the three distinct style options to help you visualize thematic data:
- Boundary heat maps use shaded regions to depict data intensity, using color gradients or distinct colors to highlight data variation across geographic boundaries.
- Dot density maps display individual points to represent a certain amount of a selected variable, for example, each dot might be equivalent to 100 people. The more dots clustered together, the higher the density.
- Symbol-based maps use circular markers scaled and styled based on data values, to emphasize target demographics or psychographics. These symbols can increase in size proportional to the data ranges you set.
All three methods are great ways to visualize your data. What you choose depends on what data you’re looking at and what kind of story you’re trying to tell.
The next few sections will provide step-by-step instructions on how to create all three of these thematic layer styles. Note that layers can be edited after being added to the map, so if you need to adjust after the fact, no problem! The same style options will appear so you can adjust until you get it right.
Boundary Heat Maps
In the Add a Thematic Layer panel, select Regions to create a heat map. You’ll notice the panel will change to show the Regions style options. Let’s review them together.
- Ranges: The value range that each color on the mapset will represent.
- Click on
to adjust the:
- Number of ranges in the layer
- The method in which the ranges are divided
- Quantile: Divides the data into classes so that each range contains an equal number of data points.
- Natural Break: Groups the ranges by ensuring that there’s an equal number of points in each range
- Equal Range: An equal split between each range
- Manual: Ranges are selected and designed by the person adding the layer. Use this option if you want more control over range values and how the data is displayed.
- Unique: Ranges are added based on the number of variables in the source table. Not applicable for thematic layers.
- Scope: On what map scale (Entire Country or Current Map View) do you want the ranges to be divided when using one of the methods mentioned above, except Manual.
- Entire Country: The range values are calculated based on the prominence of the selected variable in the entire country.
- Current Map View: The range values are calculated based on the prominence of the selected variable in section of the map that you’re in when adding the layer to the mapset.
- For example, if I’m adding a heatmap which represents the current year population whilst being zoomed into an area on the map that holds a low population, the range values are going to be much lower when selecting “Current Map View”, as Sitewise is basing the ranges off the population of the lowly populated area.
- Alternatively, if you’re zoomed into the same lowly populated area and select “Entire Country”, the ranges will base off the population of the entire country regardless of the population of the area which is showing in the mapset when adding the layer.
- Style: The color of each range. Each range will be given a default color and name, both can be customized to suit your needs.
- To select a predefined range of colors to use for your layer, click
, and select the color scheme which suits your needs!
- Click on the color next to each range to edit the fill and border if you want to manually adjust each range color.
- To give a range a custom name, or ‘alias’, click on the
icon.
- Labels: The label that will appear at the center of each area, providing the actual values for that area
- Click on the Label checkbox to turn labels on.
- If labels are turned on, click on the Aa to alter the zoom level at which the label is visible. You can also set the font size and color of the label, and the size and color of the halo, which help make the label pop on the map.
- Layer Name: Determines how the layer will be named in the layer panel.
- Transparency: Select how transparent the color gradient of each range will be. It is recommended not to set it all the way to the right, as you will be unable to see the underlying map, roads, town names, etc.
- Display at Zoom Range: What zoom level the layer will be visible at on the map.
- Note: We recommend setting the zoom to 10 (city-level) or above, such as 11 or 12. Keeping the zoom level around 10 ensures quick data loading as you navigate the map.
- Map Order: Determines if the layer will appear:
- Above Roads (Recommended)
- Below Roads
- Above Labels
Advanced Options
- Filter Options: Typically, not used for Boundary Heat Maps as the data is focused on a single variable.
- Display: Opt to reverse the range display in the legend, or to hide the legend for this layer when creating a map output, this includes report or layout maps.
Dot Density Layers
In the Add a Thematic Layer panel, select Dot Density. You’ll notice the panel will change to show the Dot Density style options. Let’s review it together.
- Units per dot: Choose how many units of the chosen variable are represented by a single point. For example, one dot might equal 100 people if looking at population density.
- Style: Style the dot by choosing its shape, color, and size.
- Click on the box to open the Symbol Options window and choose how you would like to display the data.
- Labels: These are not necessary for dot density maps. Each dot on the map represents the same value that is set in step 1 above. If you have any questions here and need labels, we may be able to provide alternative solutions. Please reach out to the Sitewise Team.
- Layer Name: Name the layer based on the data displayed.
- Transparency: Determines how transparent/dark each dot is displayed in the mapset.
- Zoom Range: What zoom level will the layer be visible on the map
- Map order: Determines if the layer will appear on the mapset:
- Above Roads (Recommended)
- Below Roads
- Above Labels
Advanced Options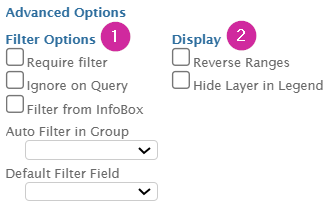
- Filter Options: Choose to filter to only show certain points on the mapset at once. Especially useful for customer spotting dot density maps.
- Display: ‘Reverse Ranges’ option isn’t relevant to dot density maps, as there are no ranges. You can opt to hide the legend for this layer in the map output.
Symbol Thematic Layers
In the Add a Thematic Layer panel, select Symbols. You’ll notice the panel will change to show the Symbols style options. Let’s review them together.
- Ranges: The value range that each color on the mapset will represent.
- Click on
- Number of ranges in the layer
- The method in which the ranges are divided
- Quantile: Divides the data into classes so that each range contains an equal number of data points.
- Natural Break: Groups the ranges by ensuring that there’s an equal number of points in each range
- Equal Range: An equal split between each range
- Manual: Ranges are selected and designed by the person adding the layer. Use this option if you want more control over range values and how the data is displayed.
- Unique: Ranges are added based on the number of variables in the source table. Not applicable for thematic layers.
- Scope: On what map scale (Entire Country or Current Map View) do you want the ranges to be divided when using one of the methods mentioned above, except Manual.
- Entire Country: The range values are calculated based on the prominence of the selected variable in the entire country.
- Current Map View: The range values are calculated based on the prominence of the selected variable in section of the map that you’re in when adding the layer to the mapset.
- For example, if I’m adding a heatmap which represents the current year population whilst being zoomed into an area on the map that holds a low population, the range values are going to be much lower when selecting “Current Map View”, as Sitewise is basing the ranges off the population of the lowly populated area.
- Alternatively, if you’re zoomed into the same lowly populated area and select “Entire Country”, the ranges will base off the population of the entire country regardless of the population of the area which is showing in the mapset when adding the layer.
- Style: Choose the color of each symbol. Each symbol will be given a default color and name, both can be customized to suit your needs.
- To select a predefined range of colors to use for your layer, click
- Click on the color next to each range to edit the fill and border if you want to manually adjust each range color.
- To give a range a custom name, or ‘alias’, click on the
- Symbol Size: Use the numbered box beside each range to adjust the size of each symbol as it appears on the mapset.
- Labels: The label that will appear above each symbol, providing the actual values for that area
- Click on the Label checkbox to turn labels on.
- If labels are turned on, click on the Aa to alter the zoom level at which the label is visible. You can also set the font size and color of the label, and the size and color of the halo, which help make the label pop on the map.
- Layer Name: Determines how the layer will be named in the layer panel.
- Transparency: Select how transparent the color gradient of each symbol will be. We recommend setting it all the way to the right to make the symbols as visible as possible.
- Display at Zoom Range: What zoom level will the layer be visible on the map
- Note: We recommend not setting the zoom too lower than level 10 as it can cause a lag when loading the layer.
- Map Order: Determines if the layer will appear:
- Above Roads (Recommended)
- Below Roads
- Above Labels
Advanced Options
- Filter Options: Typically not used for Symbol Maps as the data is focused on a single variable.
- Display: Opt to reverse the range display in the legend, or to hide the legend for this layer in the map output in both reports and Layouts.
Once all styling options have been selected, click  at the bottom of the layer styling panel to add the layer to the mapset. Your new Symbol thematic layer should look similar to the image on the right. Remember to save the mapset once the layer has been added! For more information on how to save mapsets, click here.
The Final Output
Now let’s review what all 3 of the thematic layers discussed above look like in Sitewise. Before we do, let's see how each thematic layer might look like in the layer panel:
- Boundary Heat Map Layer: Here we see our heat map layer, represented by the
icon. Each range is represented in the legend with its description, and the color used to represent the range in the mapset.
- Dot Density Layer: Dot Density layers are represented in the layer panel by the
icon as shown above. Unlike the legend in the heat maps layer, this layers legend only needs to show the dot itself (as well as its chosen shape and color) and the value that each dot represents.
- Symbol Thematic Layer: The symbol layer, represented by the
symbol, bares similarities with the legend used for the heat map. Like the heat map, the symbol layer legend provides the breakdown of each ranges value, and the color of the symbol used to represent the range. However, notice that each symbol is a different size. This is as a result of the symbol sizing done when styling the layer.
Visualizing Boundary Heat Layers
Let’s take a look at a Boundary Heat layer on the map in Sitewise.
In the image above we can see there’s a different shade covering each blockgroup on the map. Each shade refers to the range that a particular blockgroup falls under, as shown on the right layer panel.
Notice that each blockgroup also contains a numeric value because labels are switched on for the layer. Each value on this heat map represents the total estimated median household income for that blockgroup.
Visualizing Dot Density Layers
Let's see an example of what a Dot Density layer looks like in Sitewise.
Here we see multiple dots spread across the map. The number of dots displayed on a map is dependent on 2 factors:
- The estimated value of a chosen variable within the selected geographic boundary.
- In this case, residential population is the variable and blockgroup is the geography.
- The value attributed to each dot.
- For example, if one dot is equal to 100 and there’s an estimated population of 500 people in a blockgroup, 5 dots will be attributed to that blockgroup.
Visualizing Symbol Thematic Layers
Let's take a look at how Symbol thematic layers are displayed in Sitewise.
Each blockgroup is attributed with a symbol. The size and shade of the symbol is determined by the value of the attribute in that specific blockgroup.
The blockgroup highlighted on the map is styled with the largest and darkest green symbol. This is because 87.5% of the population in this blockgroup is white, as shown in the infobox displaying the Map Query Results on the map.
What’s Next?
We hope that this article helped in adding thematic layers to your mapset! Below are some other articles that you might find useful:
- For information on how to save mapsets, take a look at our Managing Mapsets article.
- Want to know more about the demographic data that you’re pulling into your thematic layers? Click here.
- To find out more about what else you can create with layers, click here!
If you have any other questions, please don’t hesitate to reach out to Sitewise Support.
Related Articles
Tables vs Layers
What Are Layers? Layers are visual depictions of data from a user table or licensed point subscriptions, such as ChainXY orStreetLight Traffic Data. Layers can be displayed on the Sitewise map by adding it to a mapset. Layers offer numerous styling ...Adding Study Areas to Polygon Layers
Adding Study Areas to Polygon Layers At Sitewise, we understand the importance of collaboration. When working on an analysis yourself, the My Project tab is a fantastic way to quickly review a site and manage your work. In addition to saving a ...Map Navigation
The Sitewise map can be used to view locations and other custom data across the US, Canada, or any location around the world. While you are on the Map tab, there are a multitude of methods you can use to navigate and get a view of the specific state, ...Share Map
Meet Share Map, a quick and easy way to create and share custom maps with external parties or those that don't license Sitewise within your organization. You can choose an area on the map, add data layers and study areas (e.g. circle or drive time ...Link Geography to a Table
At Sitewise, we understand that proper data visualization is essential for site analysis and effective future planning. You can link your uploaded file to a standard geographic boundary within Sitewise, enabling you to display your data as a thematic ...